

Why do some regions of the world experience a pandemic differently? We can better understand how demographic variables and policy enforcement affect epidemic spreading through visualization. Compare two scenarios by describing the population densities and testing rates of two simulated populations below.
This model is inspired by the parallels between epidemics and forest fires – except that in an epidemic, the “trees” can move around and infect others with their “fire.” The model used to create these visualizations accounts for three types of people.

The SIR model is a common method of understanding epidemic spreading, and we have modified it to include the category of quarantined people to understand how testing for the virus affects the population. The model works by alternating between people making a randomized movement, and allowing people to transition types, with these simple rules:
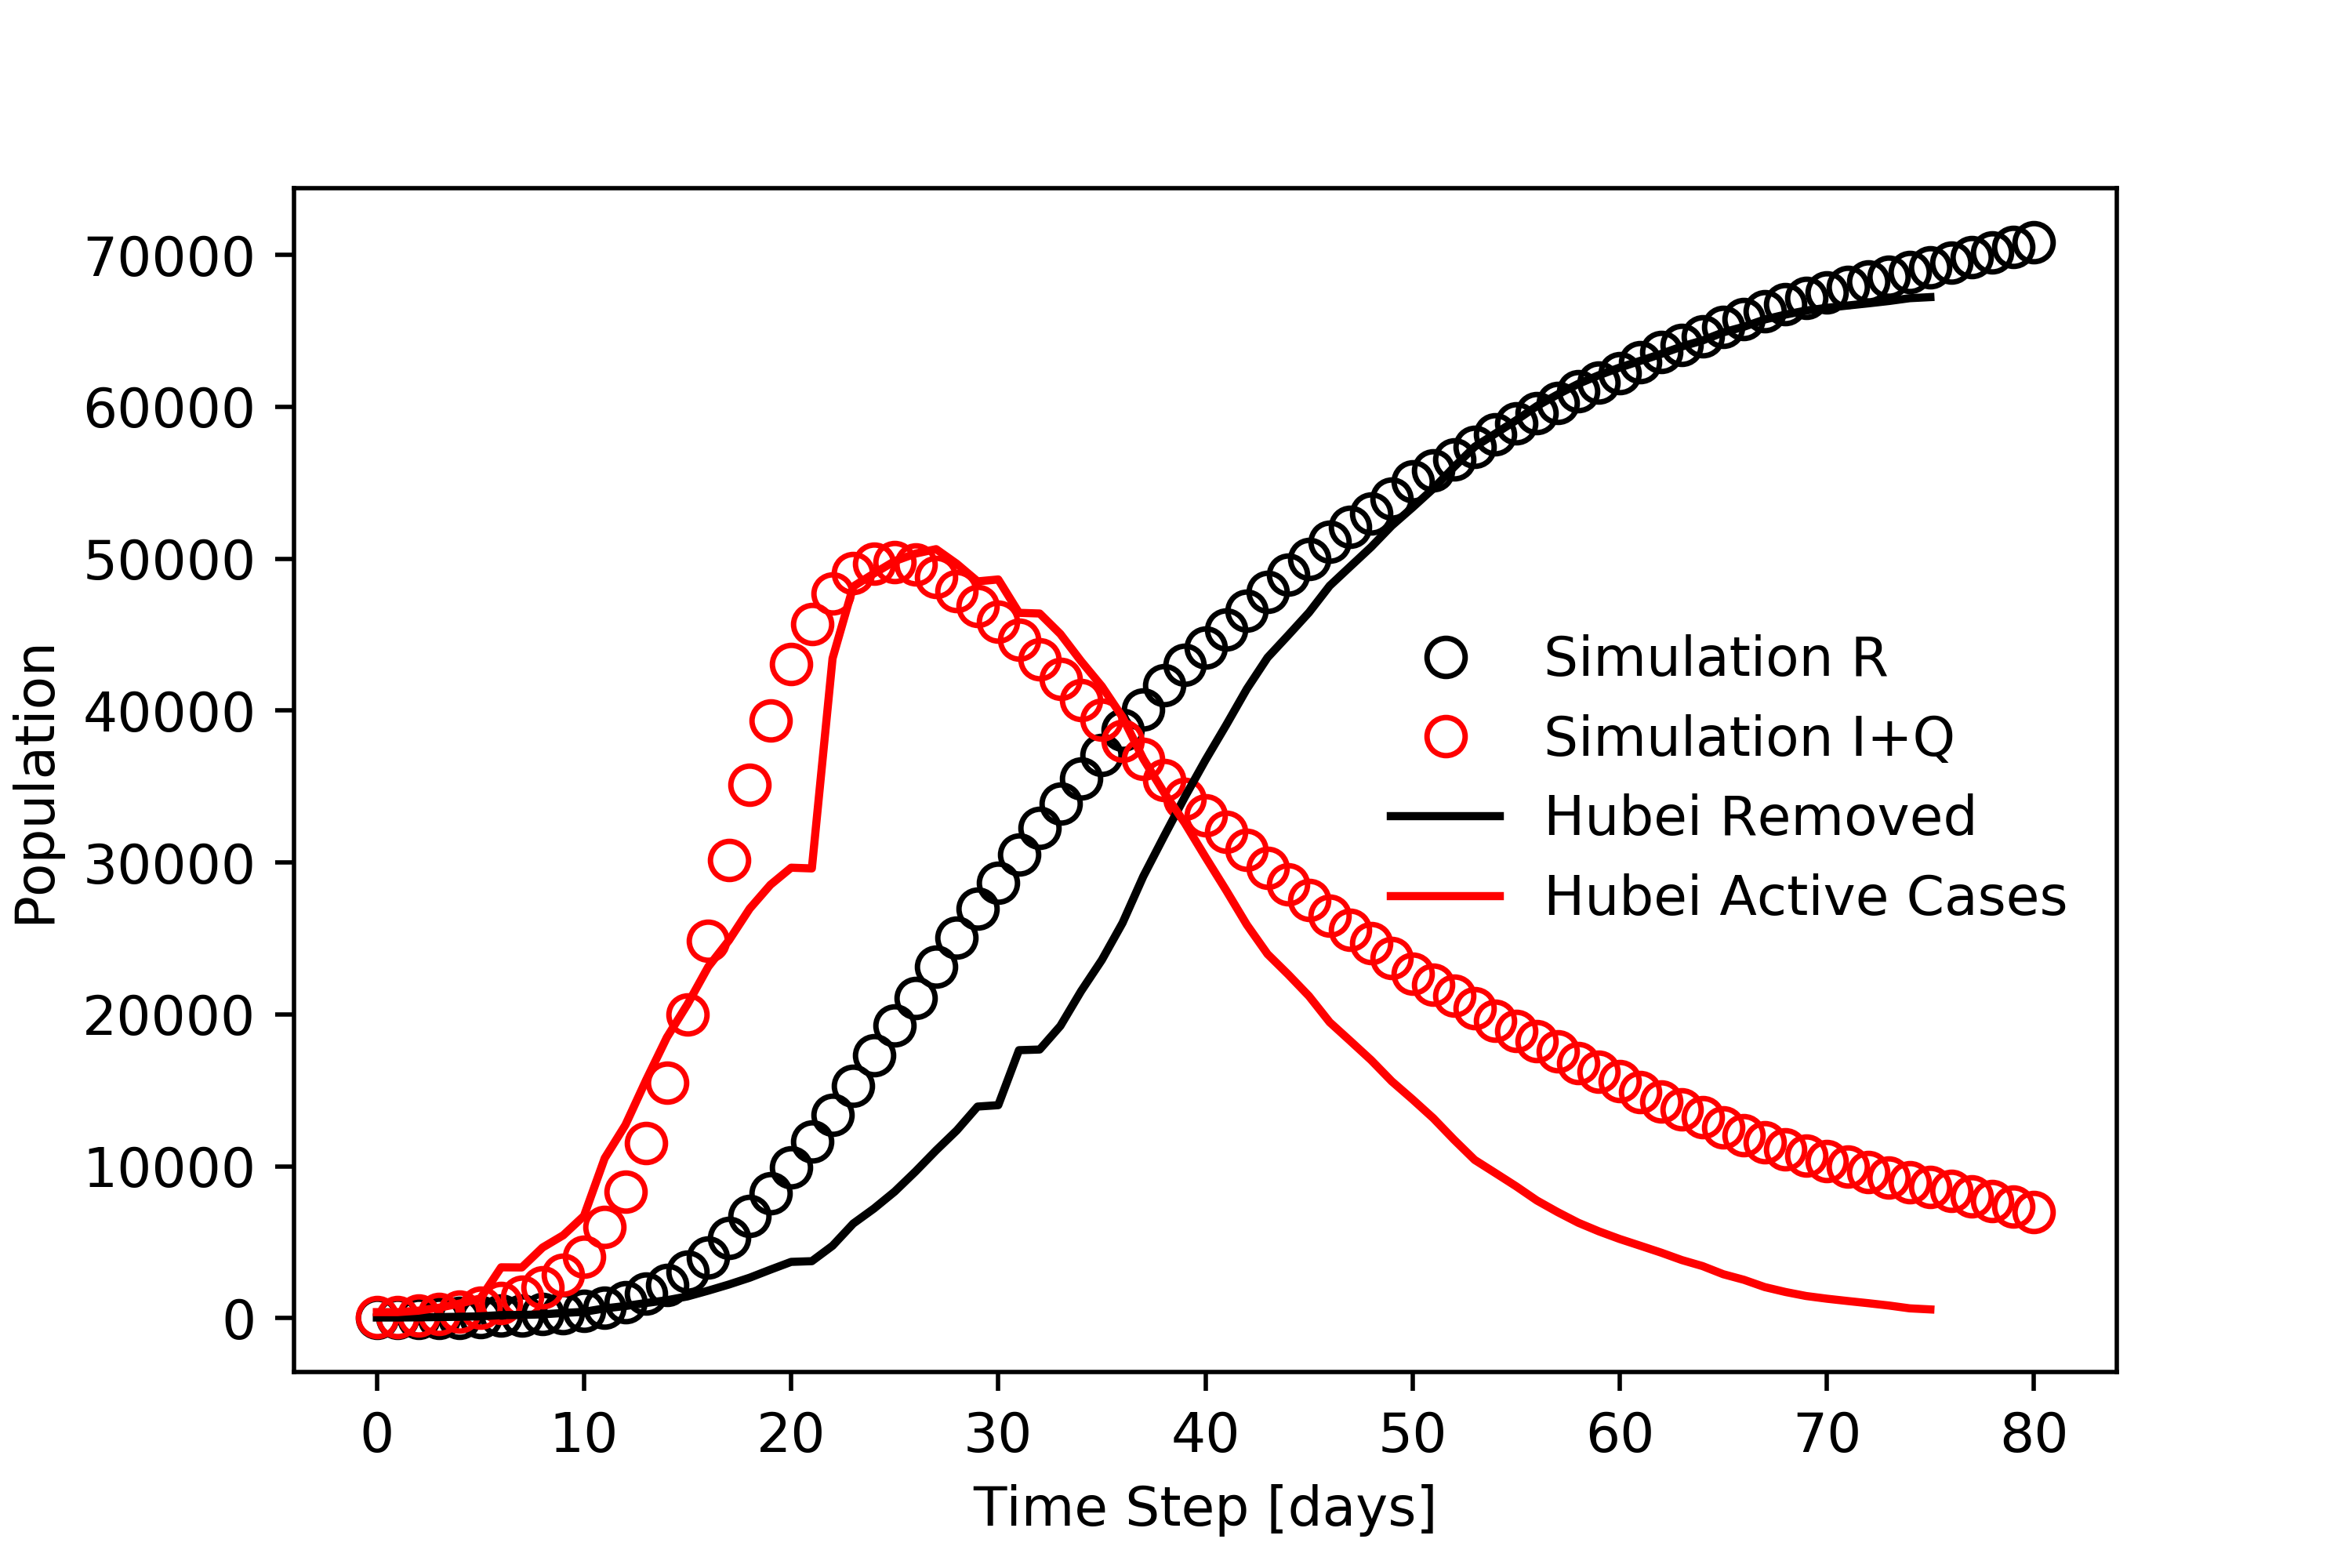
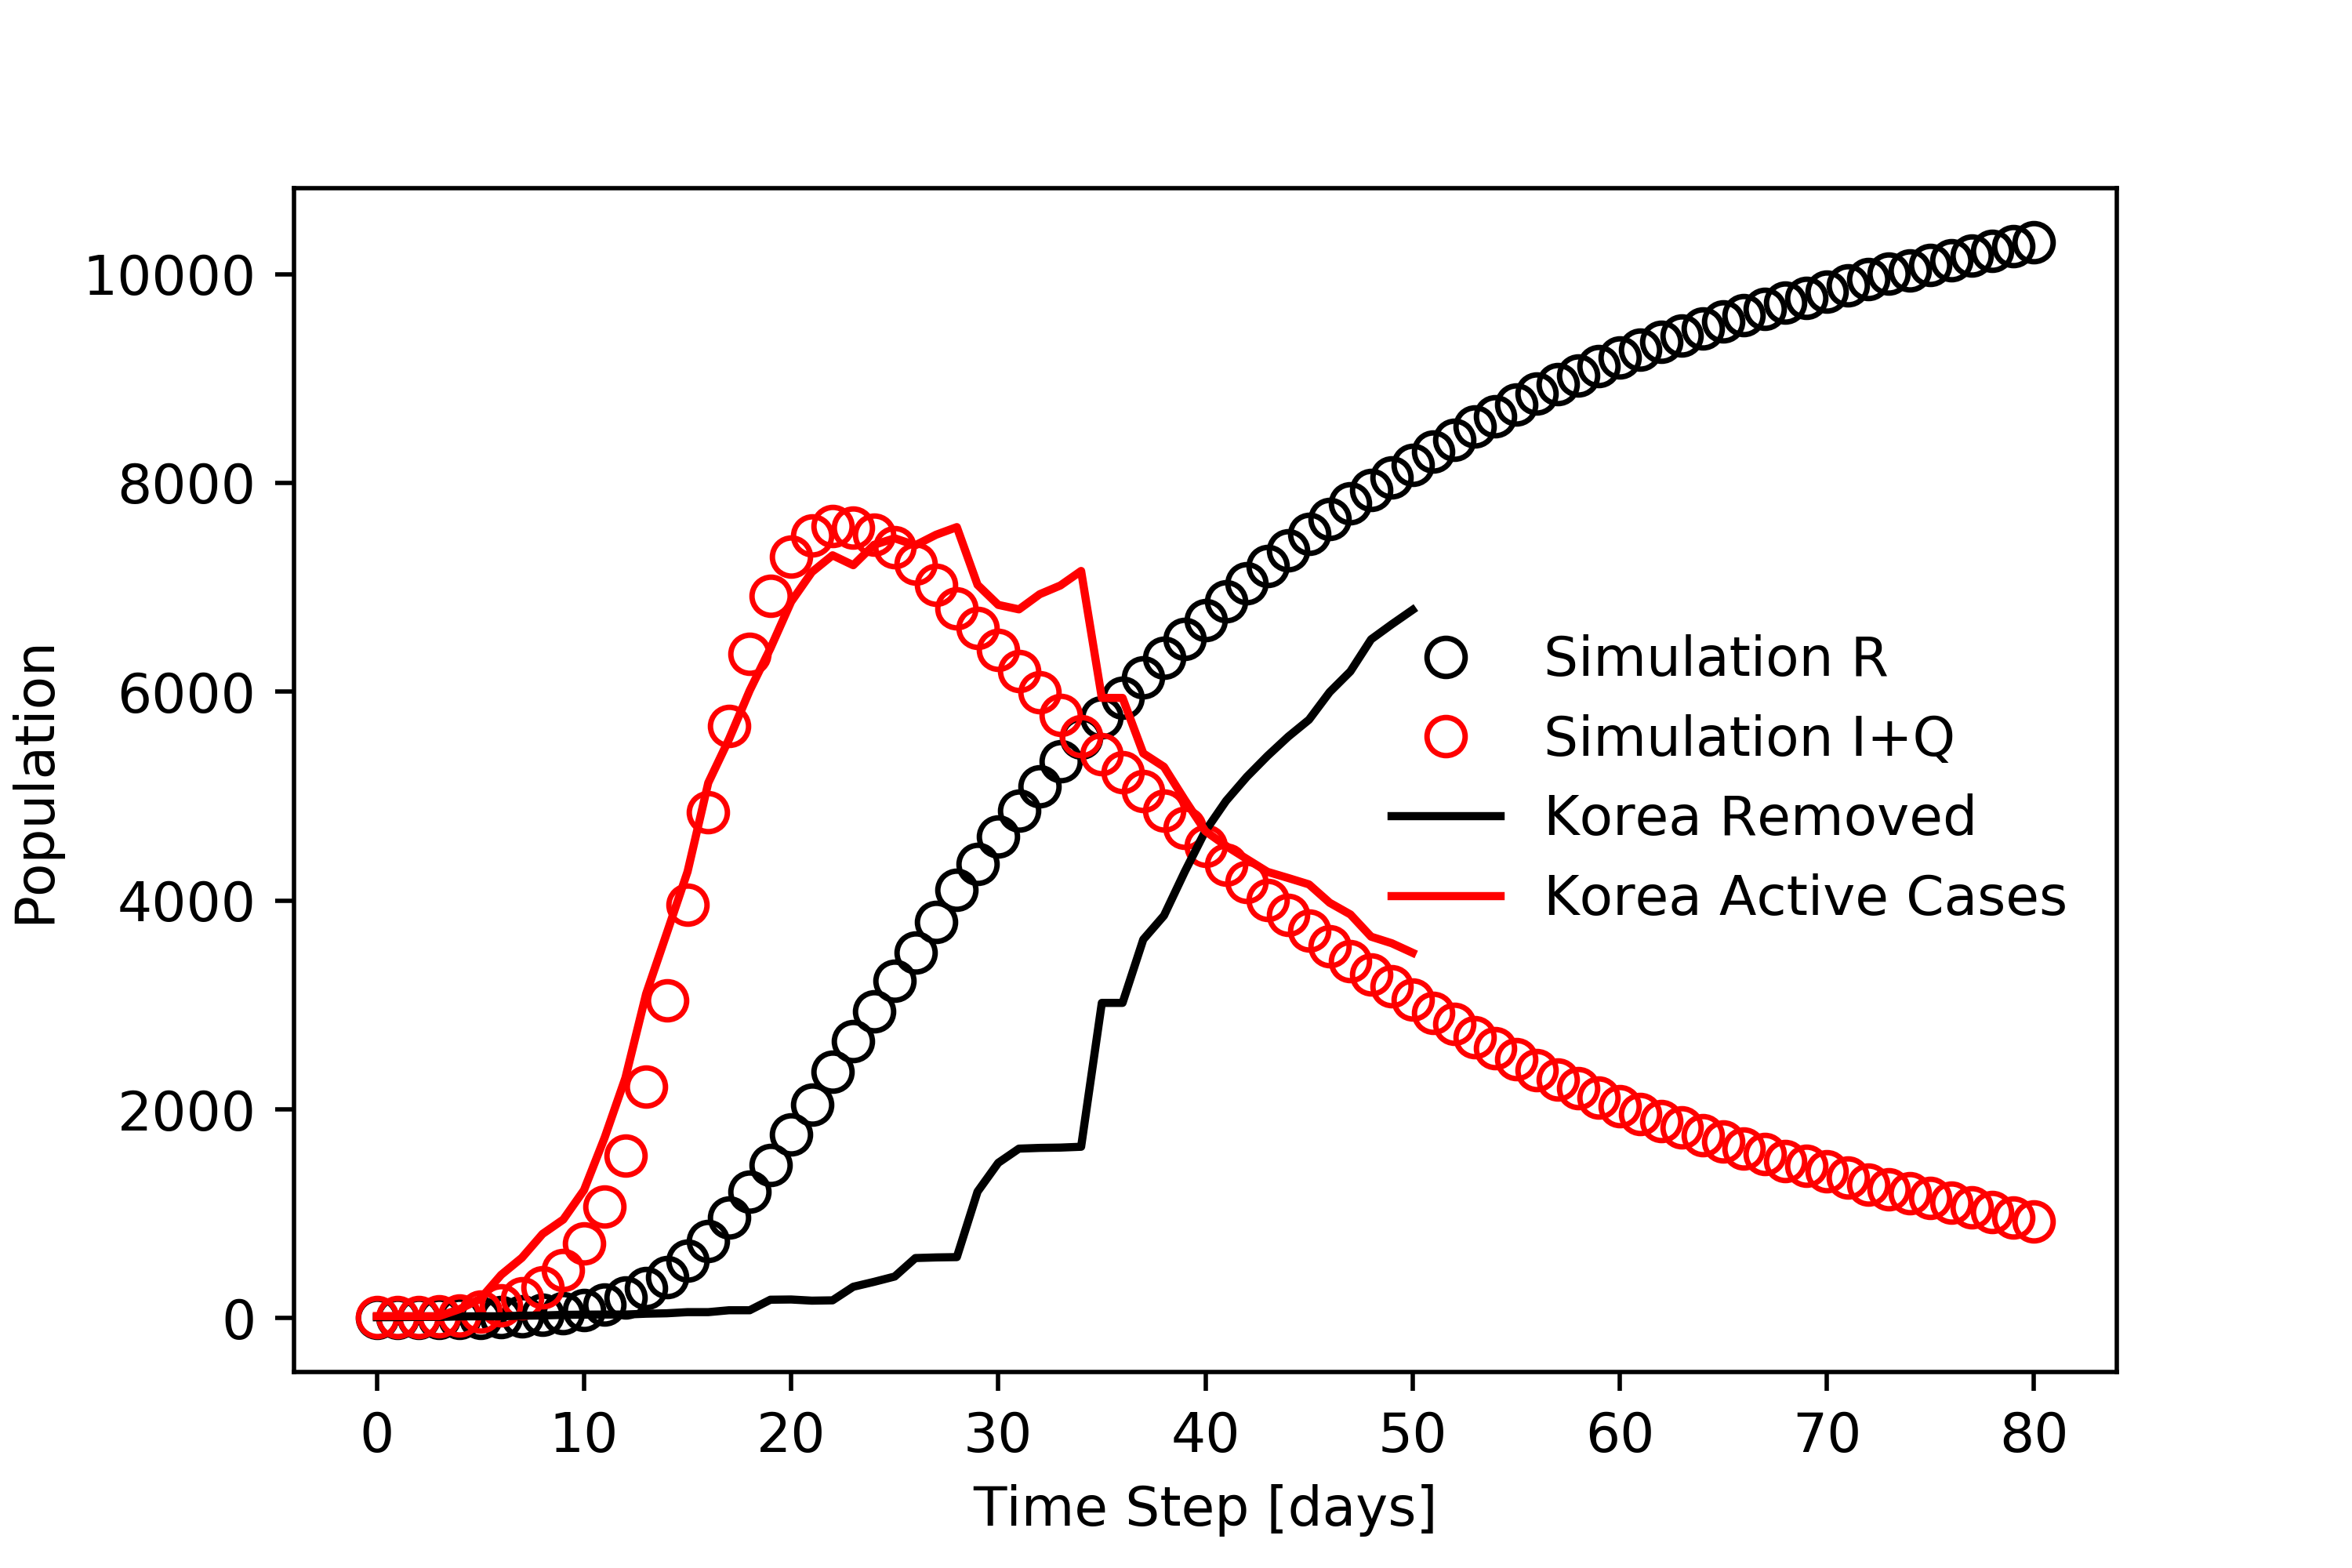
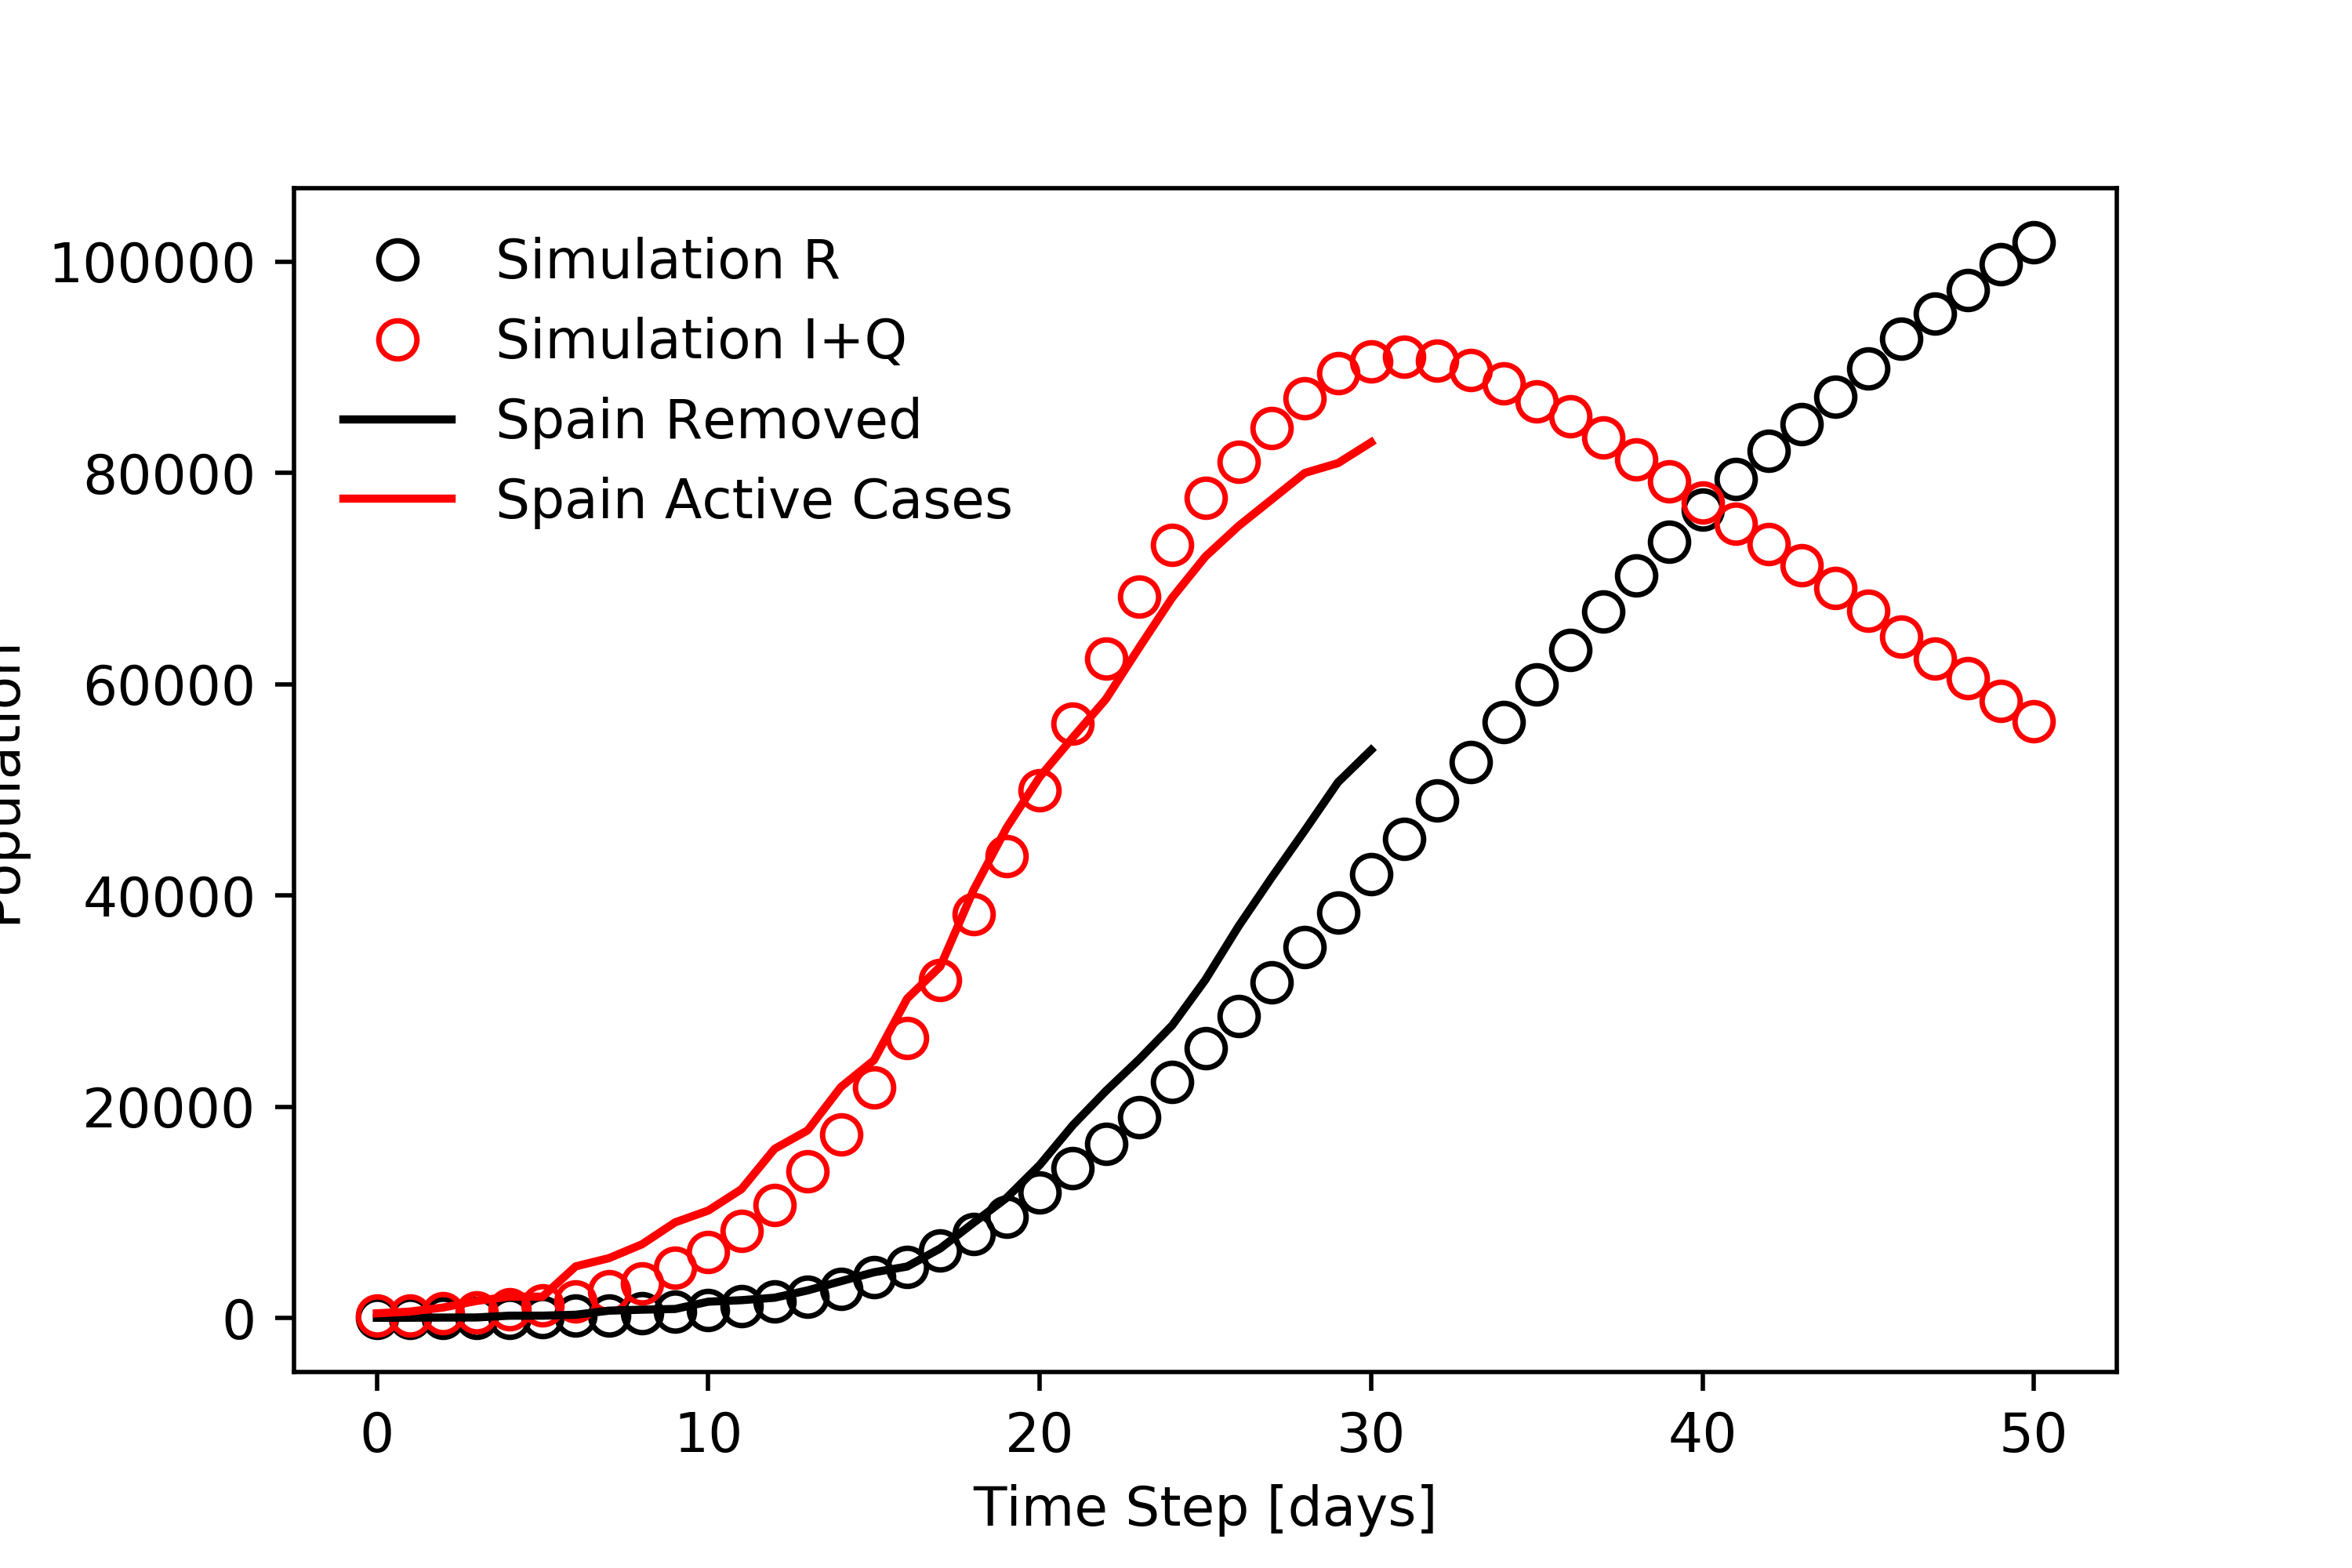
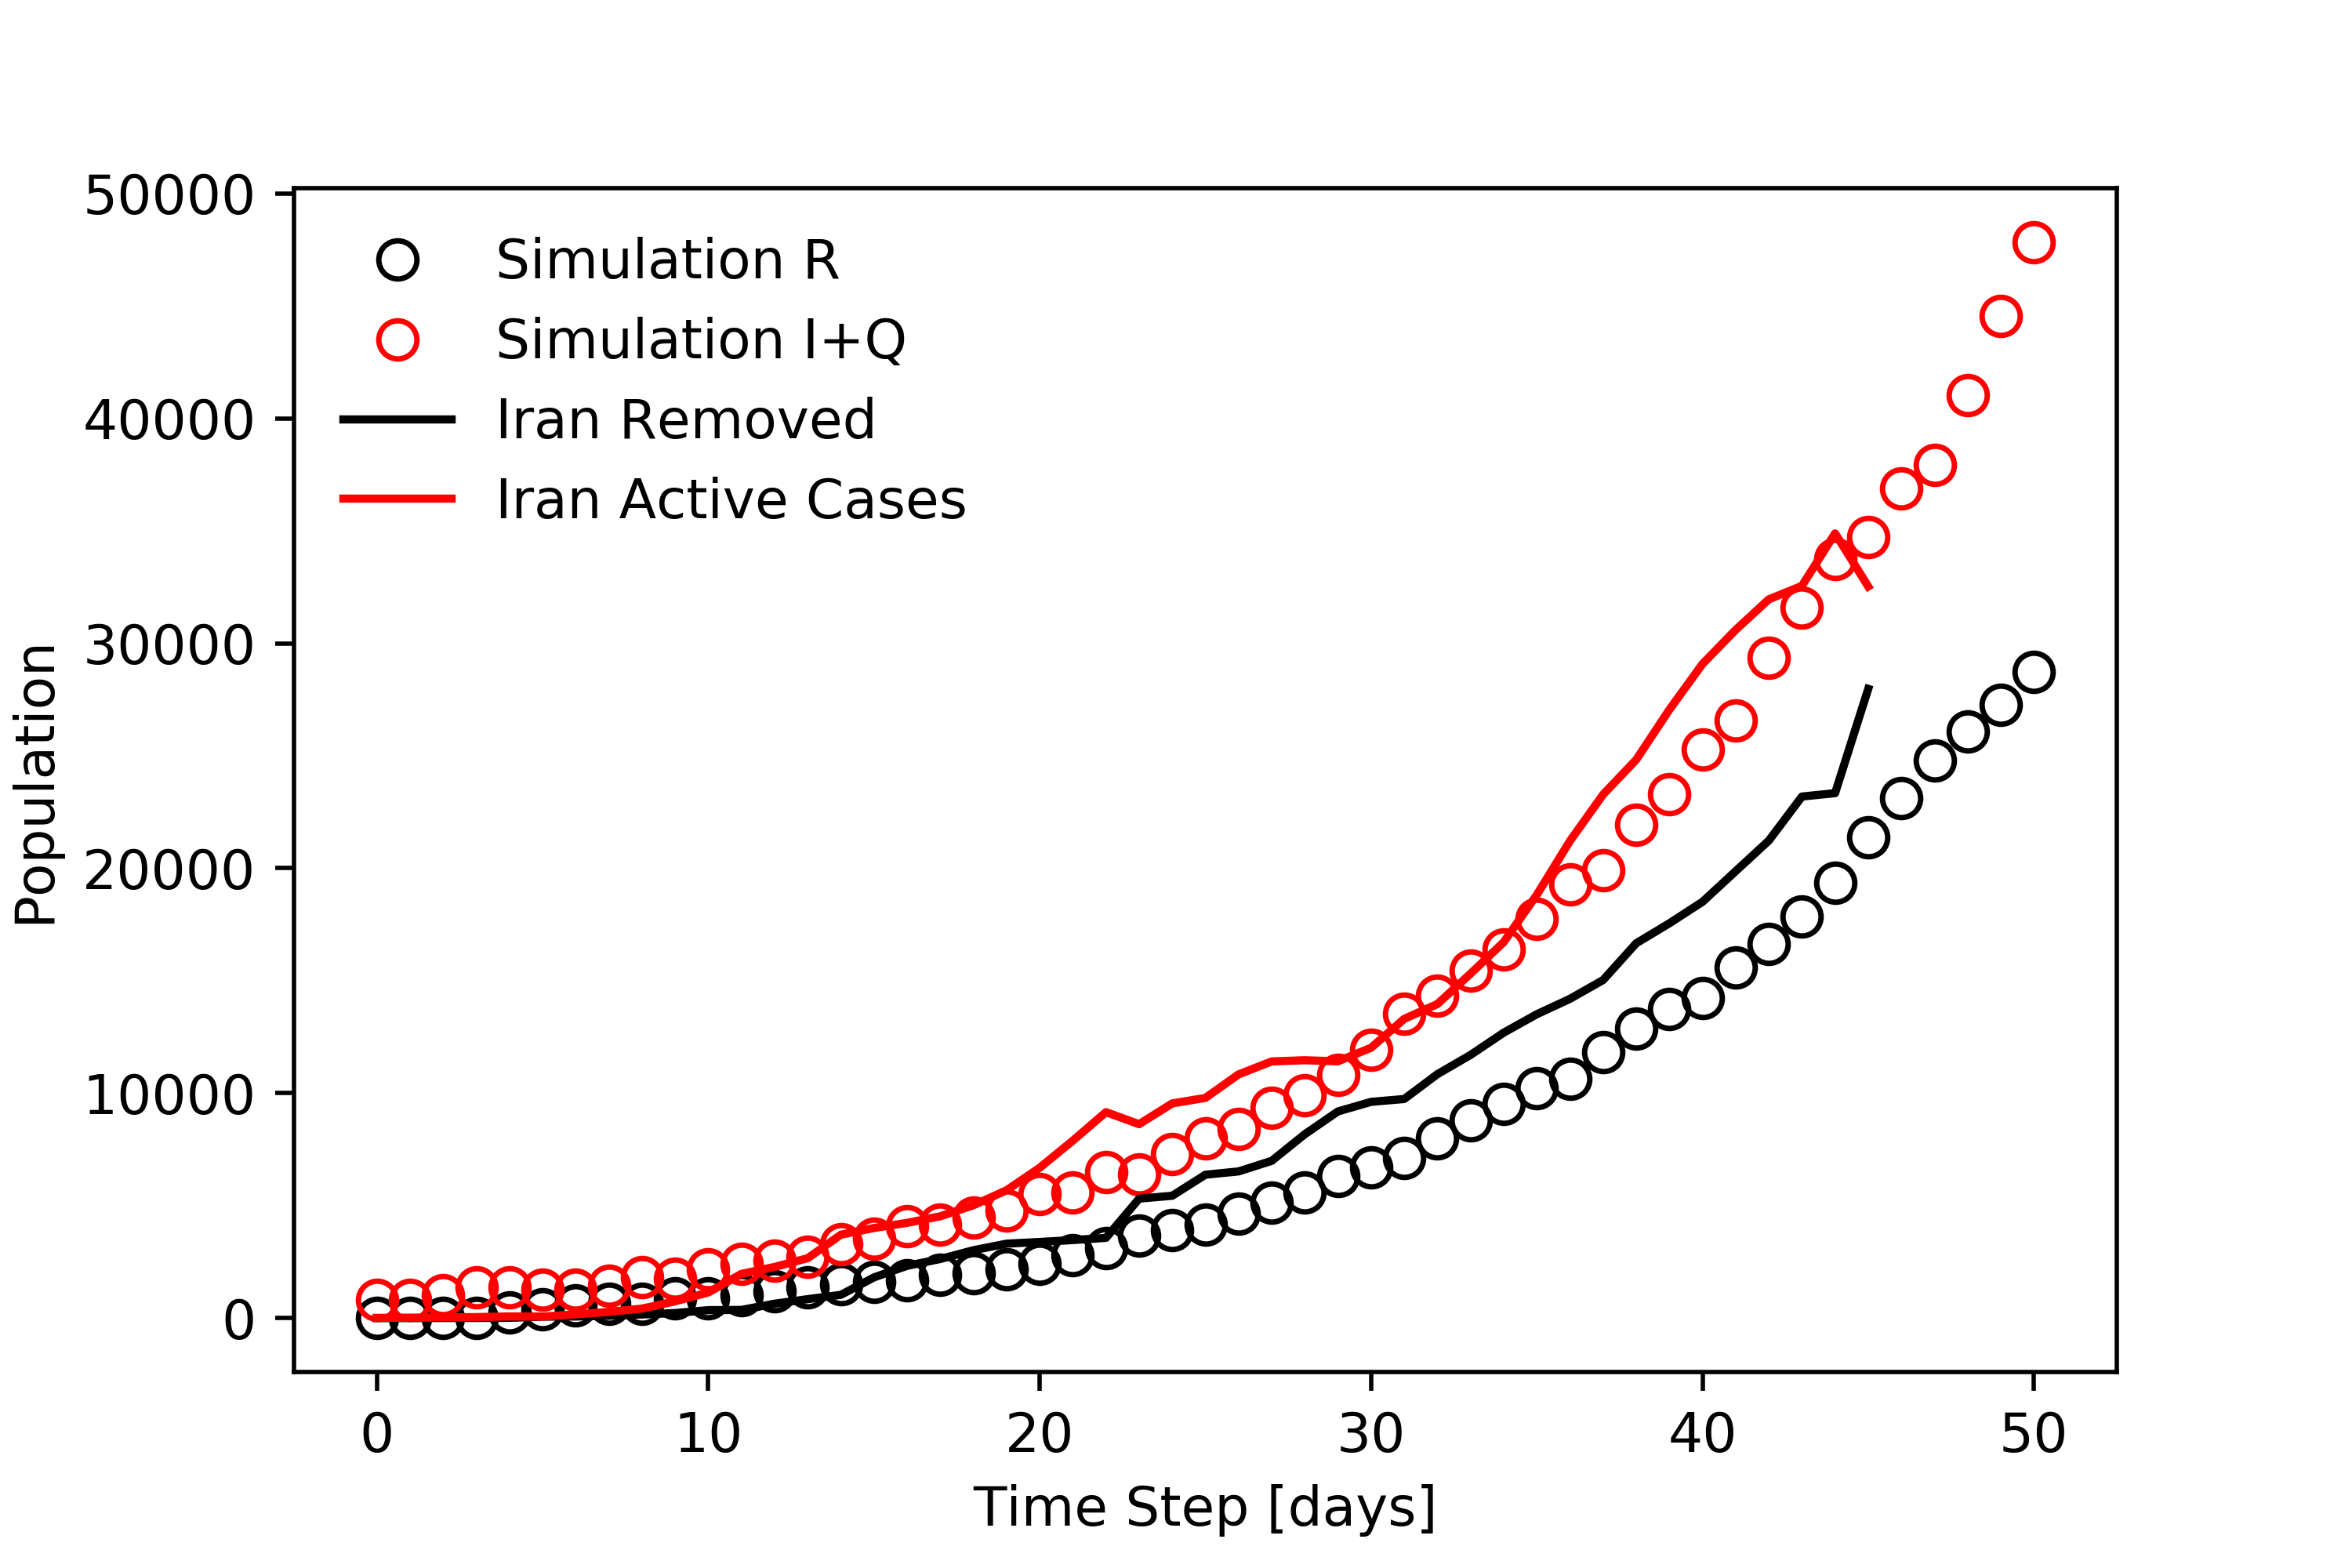
One of the most critical aspects of a disease is its reproductive number, which for this model is the ratio of the probabilities of transmission to recovery. The higher this number, the more severe the resulting epidemic. The precise reproductive number for CoVID-19 is not known, but is estimated to be as high as 7.0. Using this, we can fit the model to real data to simulate the spread of the disease in real regions of the world affected by the pandemic. Below, we can see how the simulation compares to data from Hubei (China), South Korea, Spain, and Iran.
Hubei, China (left) and South Korea (right) have experienced the peak infection, shown below.
Spain (left) is forecasted to experience the peak soon, while Iran (right) still has exponential increase in confirmed cases, shown below.
There are many reasons why every region of the world would experience a virus in a unique way, ranging from demographic qualities to policy enforcement such as lockdowns and quarantining. It’s difficult to scientifically measure the exact effect of these variables, because it’s impossible to repeat an experiment about the epidemic while controlling many variables exactly. However, with this simulation, we can get an idea for how certain variables directly come into play.
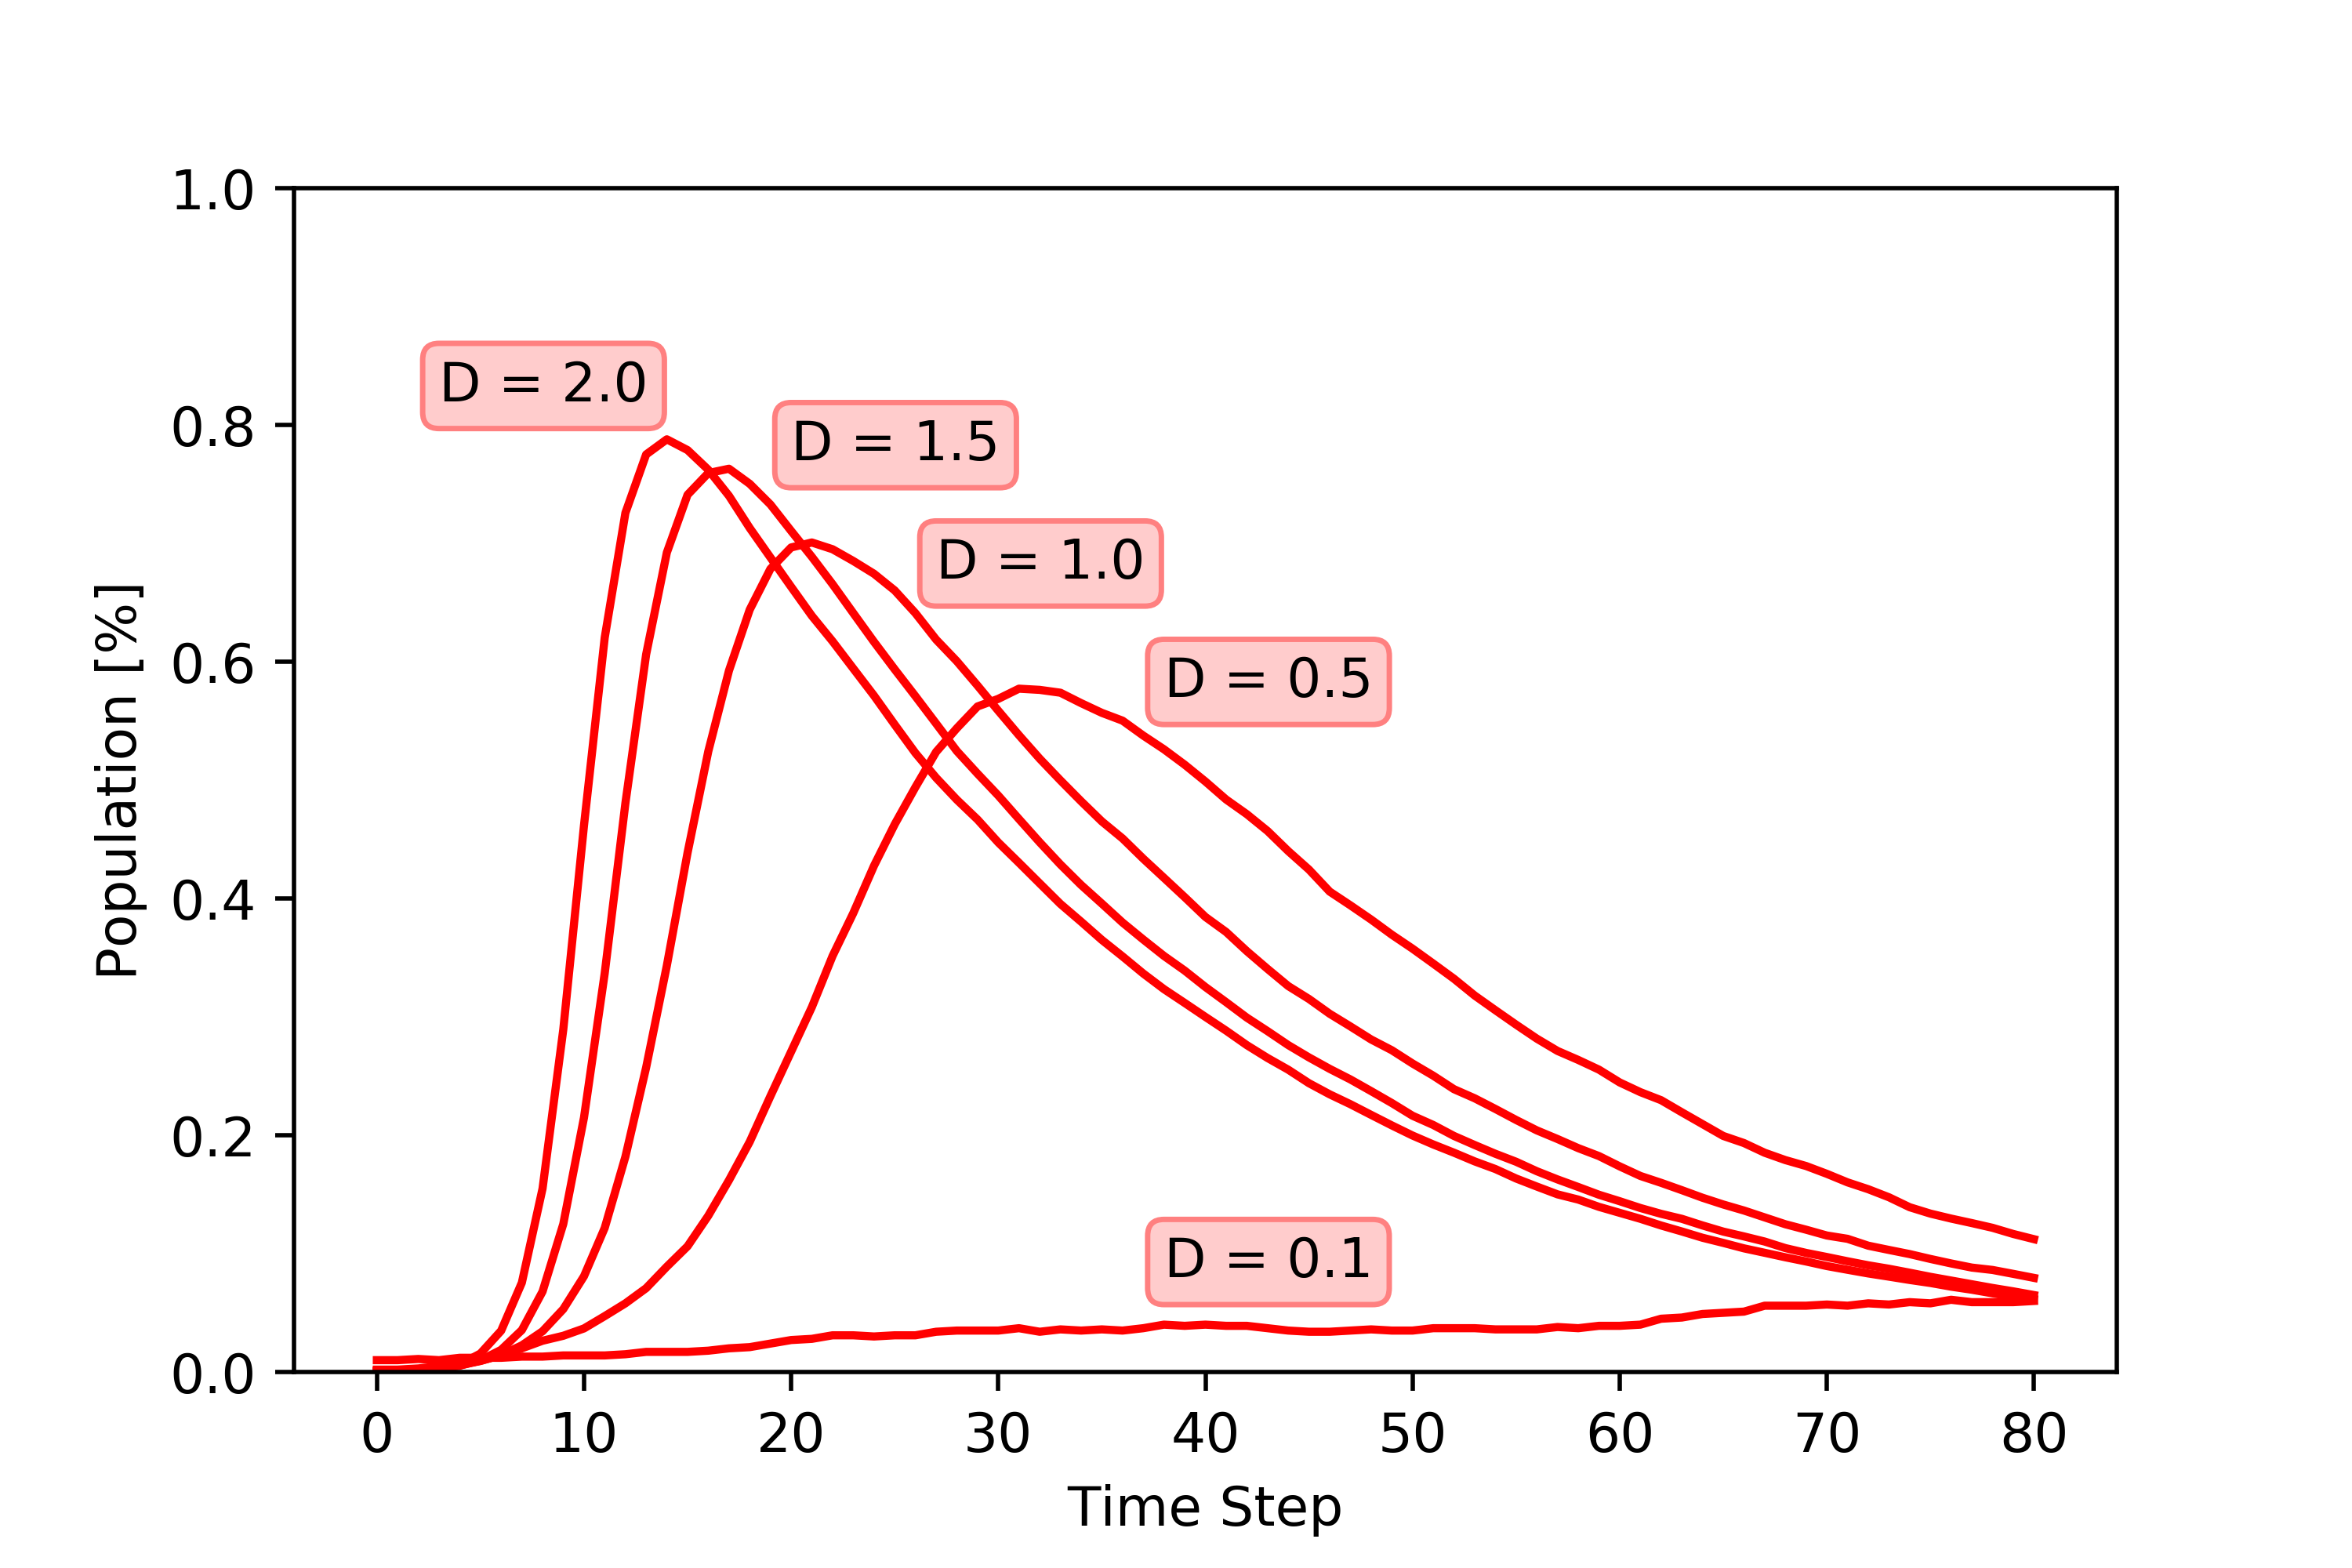
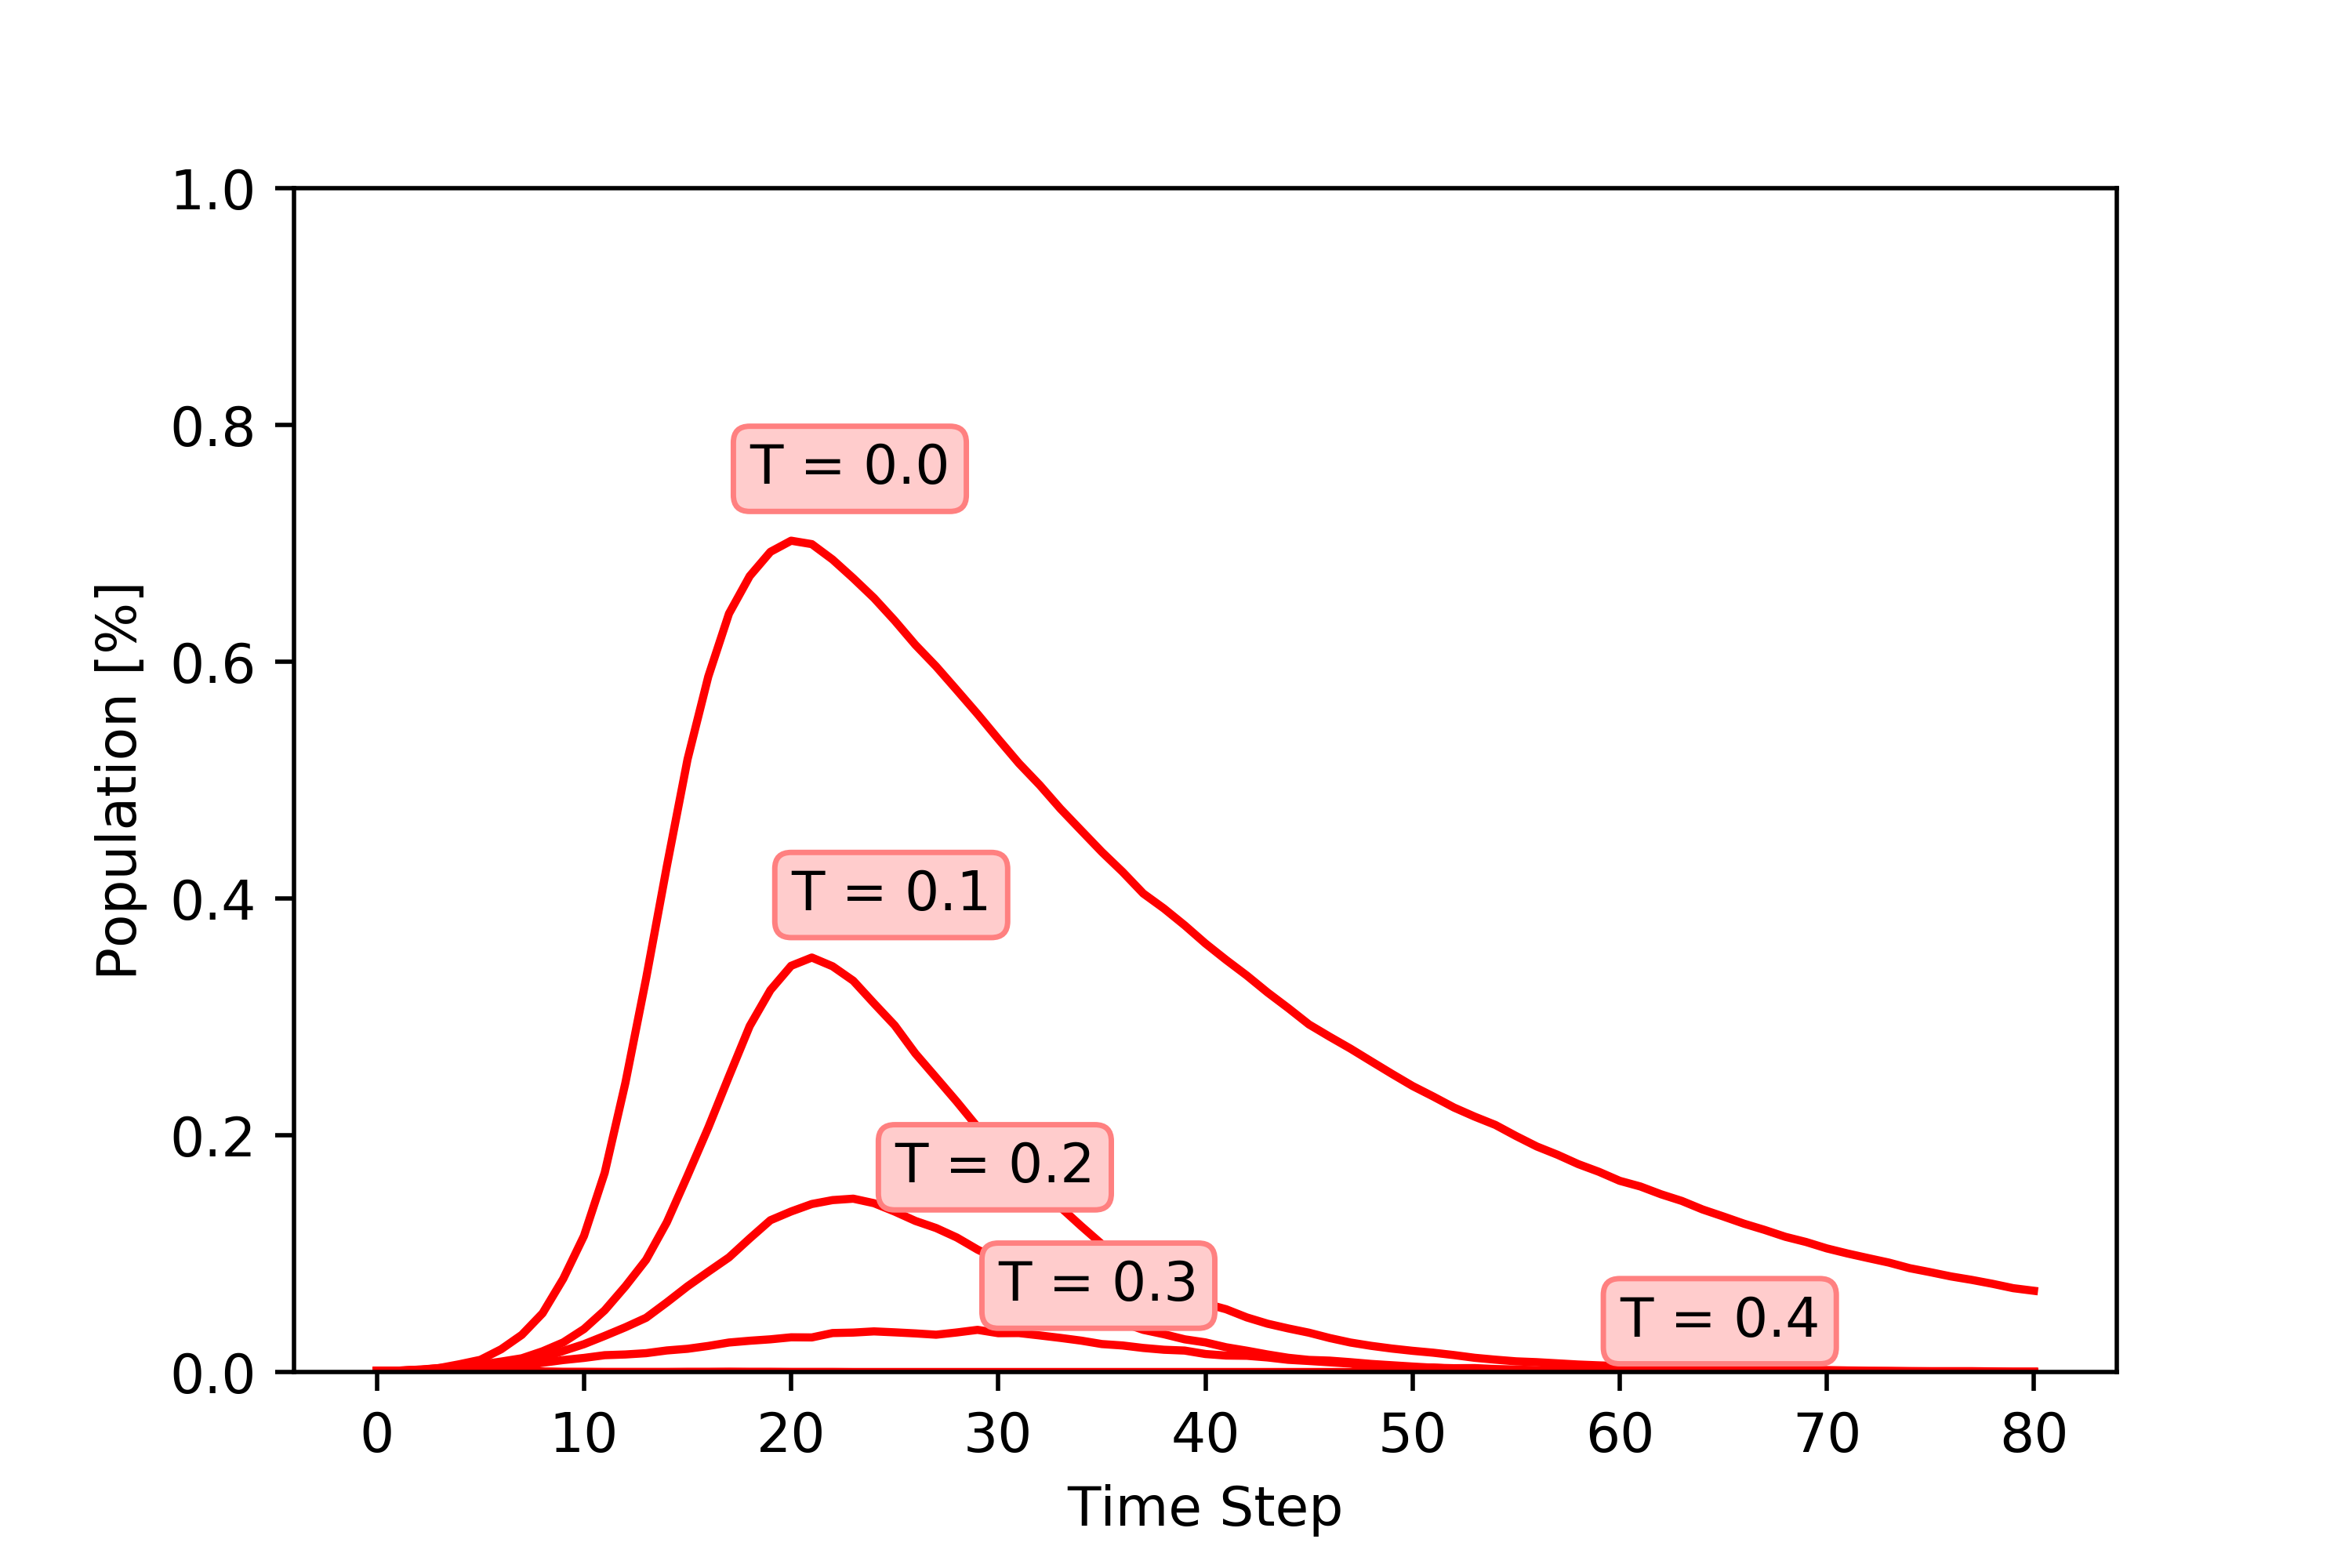
We focus primarily on 1) population density (D) and 2) testing rates (T) for CoVID-19. By considering the populations of infected people, we can see that less densely populated regions have more time before the peak hits. We also see that by testing at a higher rate, the peak number of infected cases can be reduced.
Finally, we can look at both these variables (population density and testing rate) at the same time. It is apparent that with higher rates of testing, even a densely populated region can avoid a high peak of infection. Similarly, even less densely populated areas can experience high rates of infection if they don’t test and quarantine.

If you find these simulations interesting, please check out our paper which goes into more detail regarding the algorithm and model used.
Markovian Random Walk Modeling and Visualization of the Epidemic Spread of CoVID-19If you would like to build on this model, we’d love to provide you with the code. Please email haluk@mit.edu for this, and feel free to cite our paper if you find it useful.
@article{akay2020markovian,
title={Markovian Random Walk Modeling and Visualization of the Epidemic Spread of CoVID-19},
author={Akay, Haluk and Barbastathis, George},
journal={medRxiv},
year={2020}
}
Copyright © 2020 Haluk Akay and George Barbastathis